R&S Intro to basic spectrum analyzer operation
Published
Acronyms
- RBW: resolution bandwidth
- VBW: video bandwidth
- DANL: displayed average noise level
What is a spectrum analyzer?
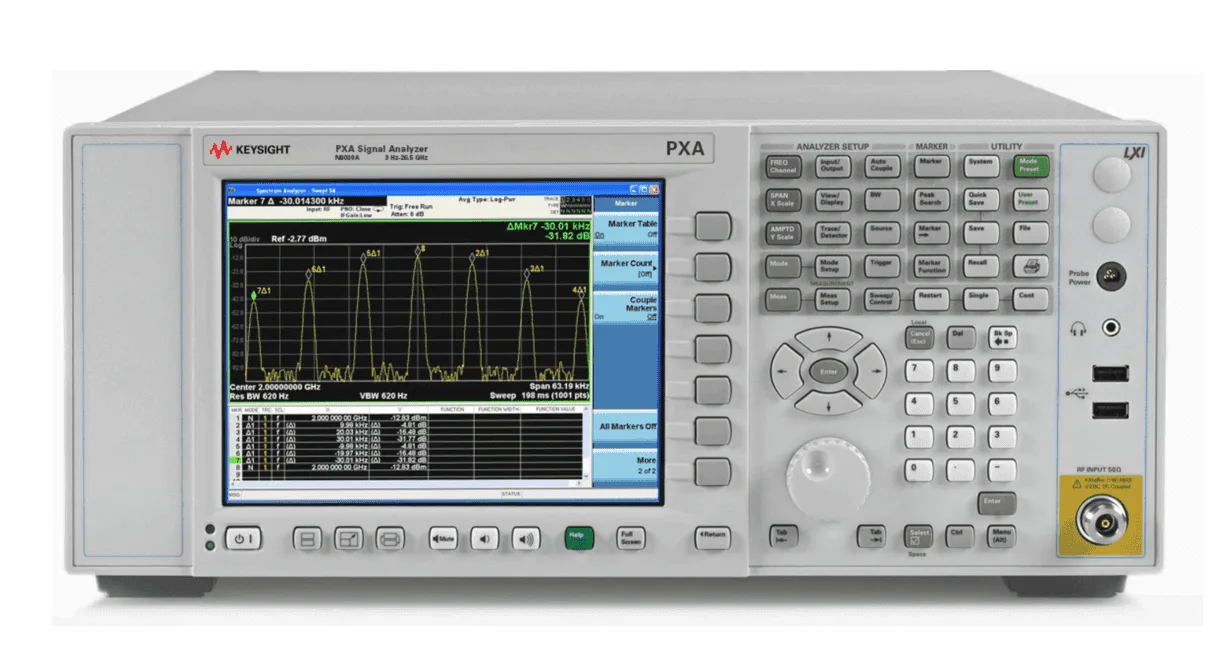
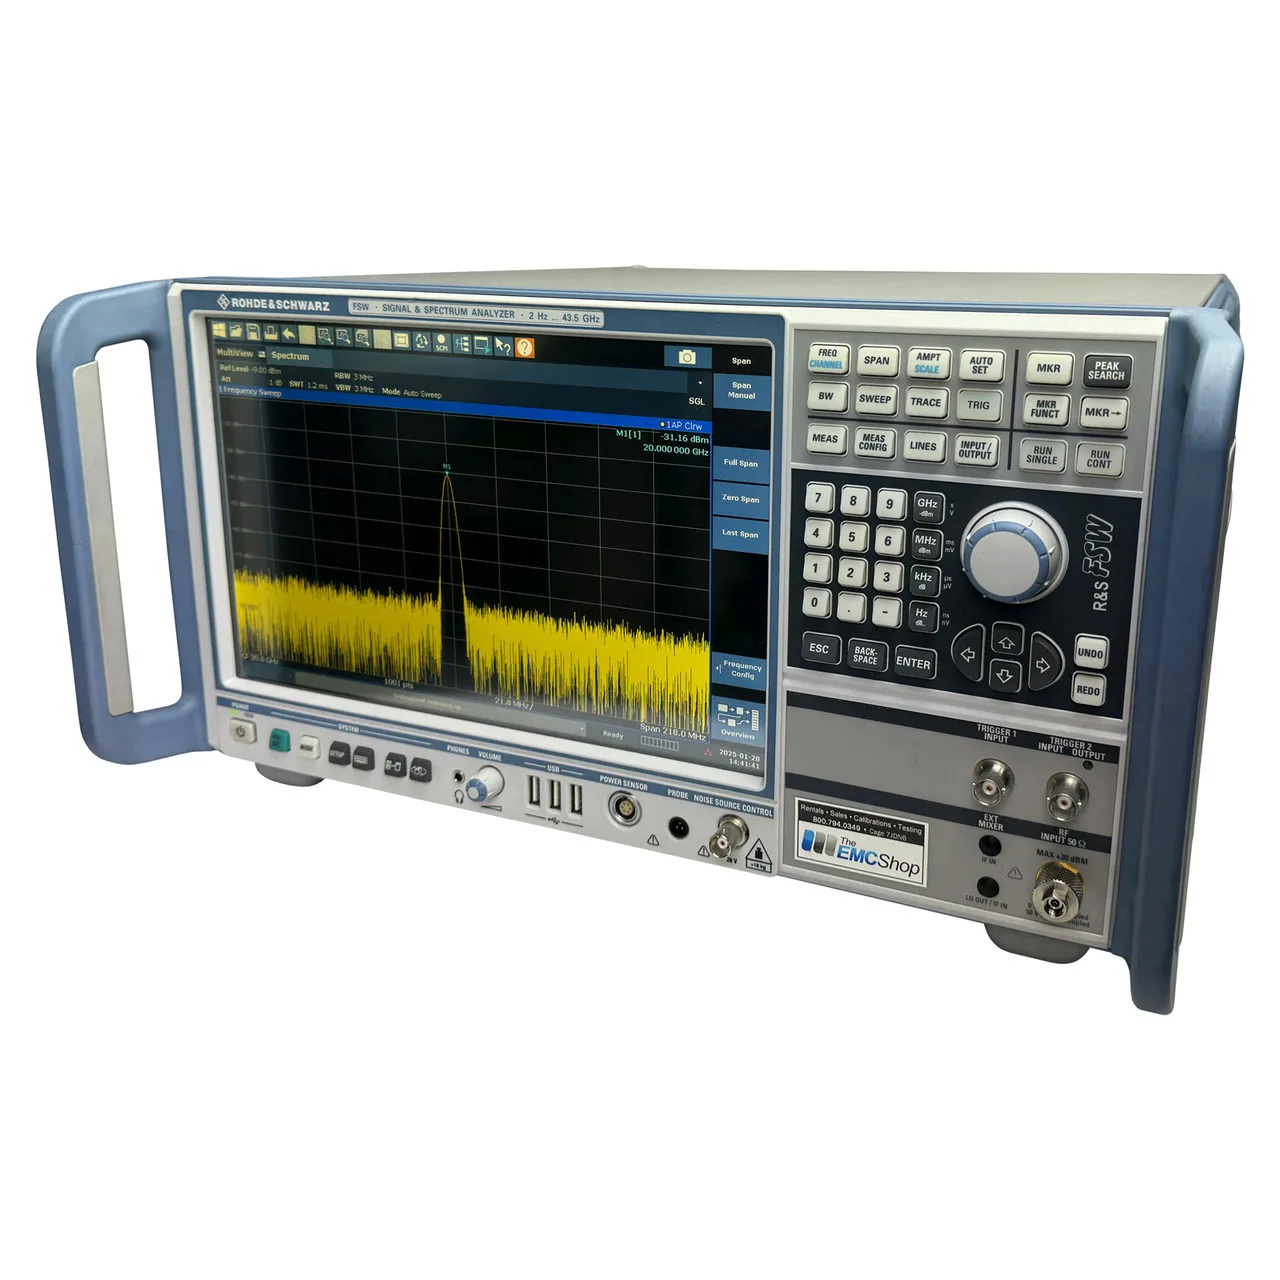
This blog post is for RF beginners and for someone who wants to learn practical ways to use a spectrum analyzer. A spectrum analyzer is an RF measurement device that displays the power of a signal over frequency. They look like this:
Why this article is relevant
Spectrum analyzers are one of the most important RF measurement devices used in characterizing and debugging analog devices like amplifiers and filters. It is helpful to think of them as power sensors that allow you to look at multiple tones. In my experience taking measurements on RF converters and amplifiers, they give you a quick way to see if a signal is passing through a device, if any parasitic tones are getting added, or if a filter is doing its job rejecting mixing products. They are easy to configure and widely available.
What the R&S article covers
This is Rohde & Schwarz's Understanding basic spectrum analyzer operation article about the measurements and settings of a spectrum analyzer. It covers the main parameters I am focusing on here: resolution bandwidth, video bandwidth, reference level, span, and center frequency.
RBW
Resolution bandwidth is essentially the passband of a filter at the input of the spectrum analyzer. This chooses the width of spectrum that is measured, so the key here is what tones you are trying to measure. The resolution bandwidth must be smaller than the delta between the two tones you are looking at.
For instance, if you need to measure a 1.0 MHz tone and a 1.1 MHz tone, the RBW needs to be less than 100 kHz. Otherwise, the analyzer will sense and average the two signals together, and you will not get an accurate measurement.
Decreasing RBW makes the measurement more granular and decreases the noise floor. One great rule of thumb Paul Denisowski includes is that every 10x decrease in RBW lowers the displayed average noise level by about 10 dB.
Video BW
Video bandwidth is less important for taking data because it only affects the display of the plot on the screen. The video bandwidth is essentially averaging of the data that is sampled and how it is plotted. He adds that lowering video bandwidth only reduces noise on the trace.
Historically, older spectrum analyzers used cathode ray tube technology that drew the trace on the screen. It is called "video" because that was the display. The parameter swept the filter to average the display trace.
Reference level
The reference level is basically the maximum power set at the display and should be just above the max expected input power. This setting also affects amplification and attenuation, so it is important to choose this with your expected measured power in mind. This will make your measurement easier to interpret and also configures the device to give you a cleaner measurement.
Span
Span is straightforward. It sets the start frequency and stop frequency of the plot.
Center frequency
Center frequency is even more straightforward. It sets the frequency in the middle between the start and stop frequency.
What I have used it for
Modern spectrum analyzers like the two I have mentioned above are versatile and easily programmable. You can use software or scripting to configure and control these devices. This comes in handy when taking repetitive measurements or large amounts of samples.
There are multiple interfaces and communication protocols you can use, like Ethernet, GPIB, USB, or RS-232. My favorite is Ethernet using the communication protocol SCPI (Standard Commands for Programmable Instruments). It is easy to learn, and there are many libraries available to use it, like PyVISA for Python.
For instance, you can use Python to talk to and control a Keysight PNA-X.
Power sweeps
A power sweep is when you step the input power into an amplifier and measure the output power at each step. This is useful for characterizing gain, compression, and the point where the amplifier starts to become nonlinear.
import time
import pyvisa

rm = pyvisa.ResourceManager()

source = rm.open_resource("TCPIP0::192.168.0.10::inst0::INSTR")
spec_an = rm.open_resource("TCPIP0::192.168.0.20::inst0::INSTR")

spec_an.write("*RST")
spec_an.write(":FREQ:CENT 1.0GHz")
spec_an.write(":FREQ:SPAN 5MHz")
spec_an.write(":BAND:RES 10kHz")
spec_an.write(":CALC:MARK1:MODE POS")

source.write("*RST")
source.write(":FREQ 1.0GHz")
source.write(":OUTP ON")

for power_dbm in range(-30, 1, 5):
    source.write(f":POW {power_dbm}dBm")
    time.sleep(0.2)

    spec_an.write(":INIT;*WAI")
    measured_dbm = spec_an.query(":CALC:MARK1:Y?").strip()

    print(f"source = {power_dbm:>3} dBm, measured = {measured_dbm} dBm")

source.write(":OUTP OFF")
Debugging
I will use a spec an for initial board bring-up or to verify along a signal chain. It is great to use as a power meter.