Feedback Control Experiment extra credit lab report
This page combines my EEE 304 extra credit lab report with the original feedback control problem statement. The experiment used an Arduino Due, an LED, and a photo-transistor to build a simple closed-loop light control system.
Download Lab Problem Statement PDF
Download My Lab Report PDF
Download Lab Data Spreadsheet
Light Feedback Control
The goal was to hold a measured brightness level constant while the surrounding light changed. A bright white LED acted as the controllable light source and a photo-transistor measured the received light. The Arduino Due adjusted the LED output through PWM, closing the loop around the sensor reading.
The lab workflow moved from open-loop calibration to closed-loop control: first identify the plant, then linearize the sensor response, then tune an integral controller and observe where the physical system becomes unstable.
Bill of Materials
The original handout listed the minimum parts needed to build the light-control test circuit.
| Item | Model / Notes | Quantity |
|---|---|---|
| Arduino | Due | 1 |
| Micro USB cable | Any Android phone charger cable | 1 |
| Photo-transistor | 3034a | 2 |
| Bright white LED | 12900 mcd white LED | 1 |
| Resistor | 100 kOhm | 1 |
| Jumper wires | Male to male | 10 |
| Breadboard | Any breadboard | 1 |
Circuit Build
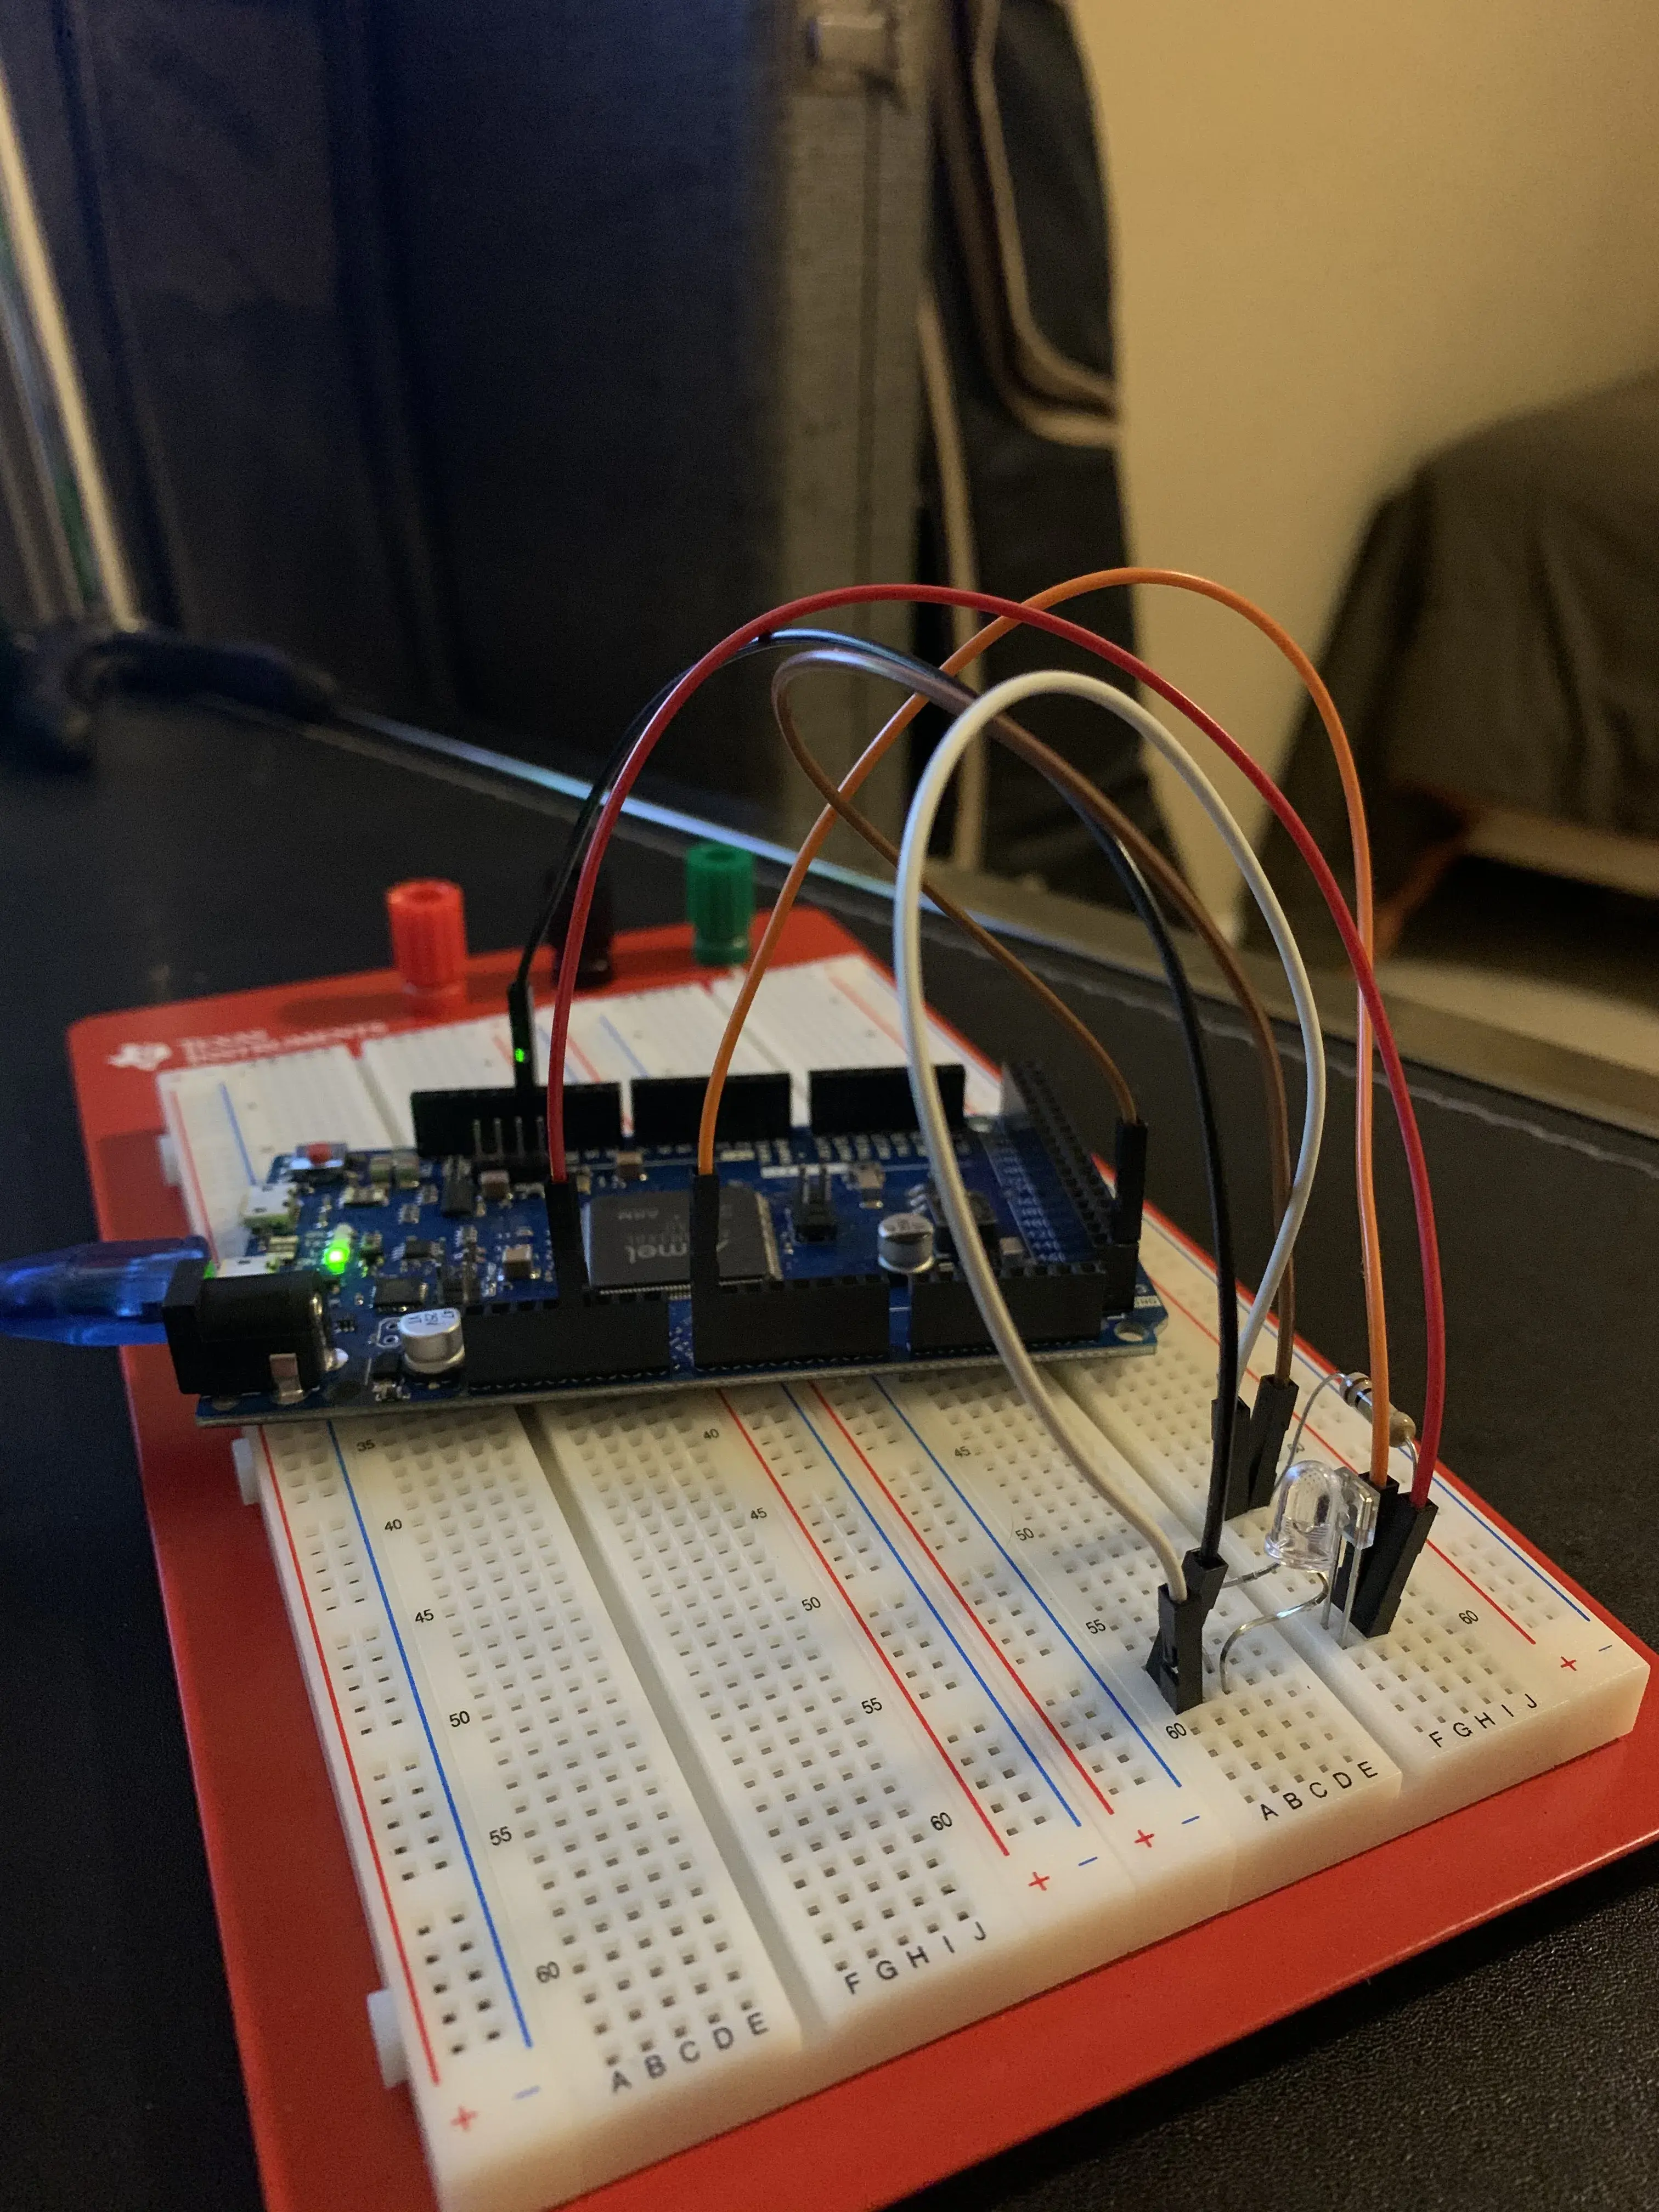
The photo-transistor collector connected to 5 V, with the emitter routed through the 100 kOhm resistor. The LED was driven from Arduino Due PWM pin 12. The handout emphasized placing the LED and sensor close together, preferably less than 1 cm apart, so the sensor could respond strongly to the LED rather than only ambient light.
The completed hardware setup is shown below with the Arduino Due, breadboard, LED, photo-transistor, and jumper wiring.
Identifying the Plant
Before designing a controller, I measured how the sensor output changed as the PWM input command increased. The raw open-loop response was nonlinear and saturated near the top of the sensor range.
| Input Command | Light Intensity Output |
|---|---|
| 10 | 35 |
| 30 | 50.25 |
| 50 | 72.25 |
| 70 | 107.5 |
| 90 | 164 |
| 110 | 260.5 |
| 130 | 429.8 |
| 150 | 724.8 |
| 170 | 1225 |
| 190 | 2035 |
| 210 | 3227 |
| 220 | 3947 |
| 224 | 4095 |
| 226 | 4095 |
| 228 | 4095 |
| 230 | 4095 |
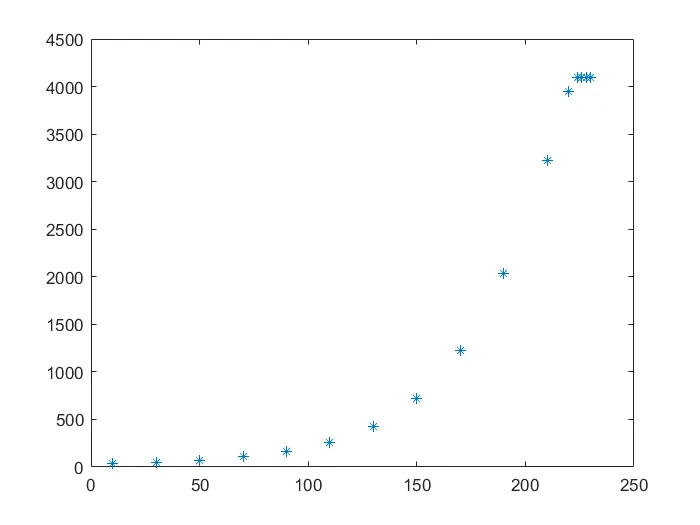
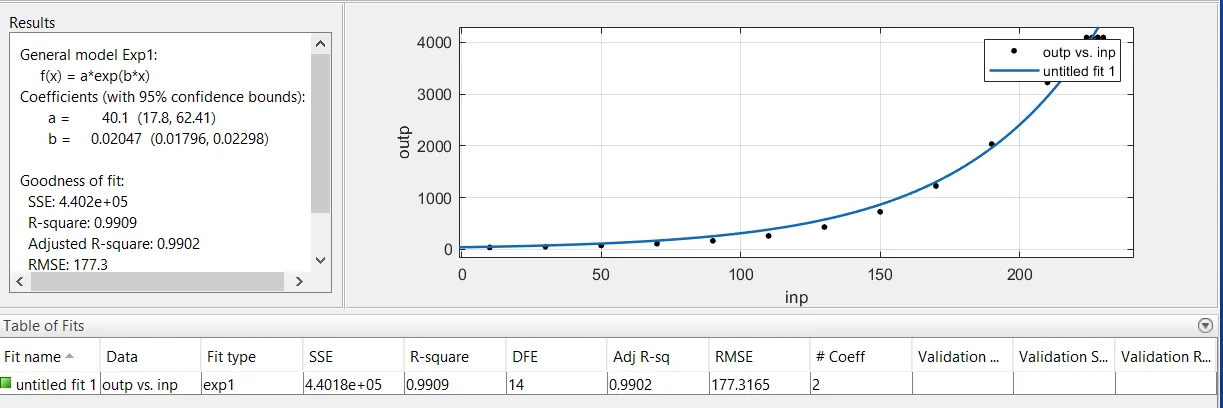
The curve fit treated the raw response as exponential. My report recorded the exponential fit coefficient a = 40.1, which was then used to configure the linearization stage.
Linearizing the Plant
After switching the Simulink model to the linearized path, I repeated the measurement table. The resulting data followed a much more linear trend than the raw sensor response.
| Input Command | Linearized Light Intensity Output |
|---|---|
| 10 | 188.8 |
| 30 | 557.8 |
| 50 | 945.8 |
| 70 | 1355 |
| 90 | 1752 |
| 110 | 2125 |
| 130 | 2509 |
| 150 | 2810 |
| 170 | 3137 |
| 190 | 3482 |
| 210 | 3771 |
| 220 | 3918 |
| 224 | 3993 |
| 226 | 3993 |
| 228 | 3993 |
| 230 | 4069 |
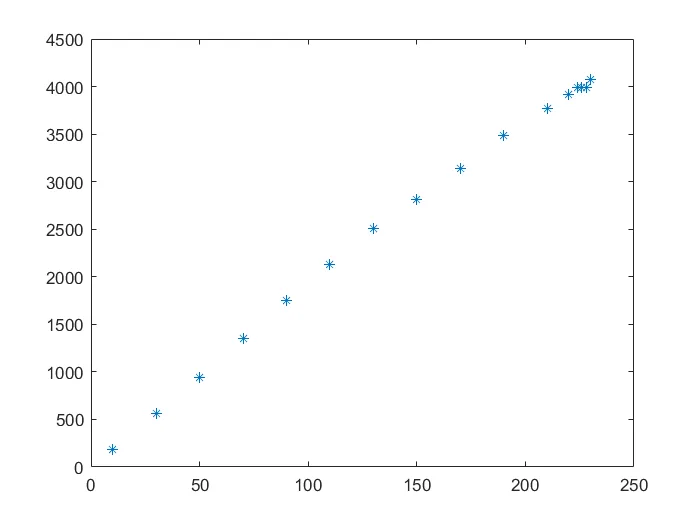
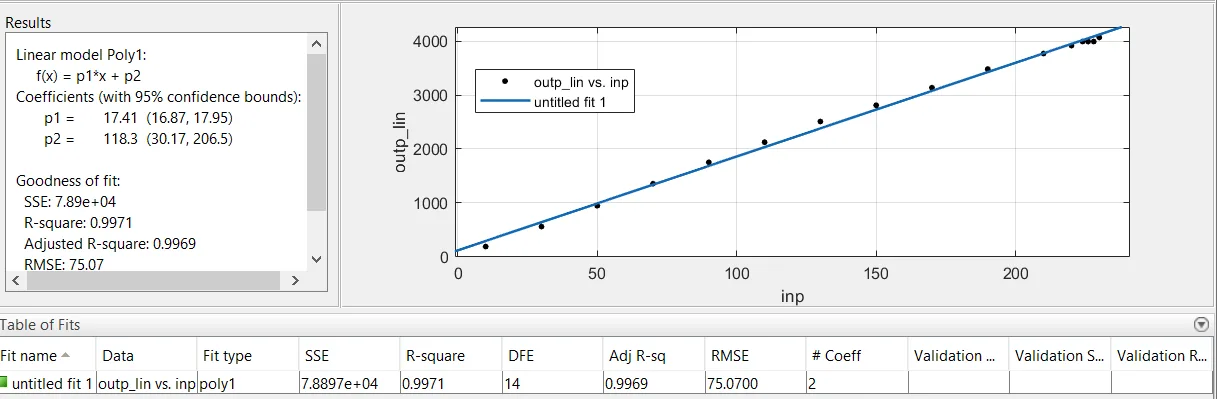
The linearized data produced a gradient of 17.41, compared with the exponential fit value of 40.1. This gave the closed-loop model a simpler gain-based plant approximation for controller testing.
Closed-Loop Integral Control
With the plant linearized, the controller stage used integral control to drive the measured light level toward a reference. In the captured scope result for integral gain 1, the output settled near the reference value around 300.
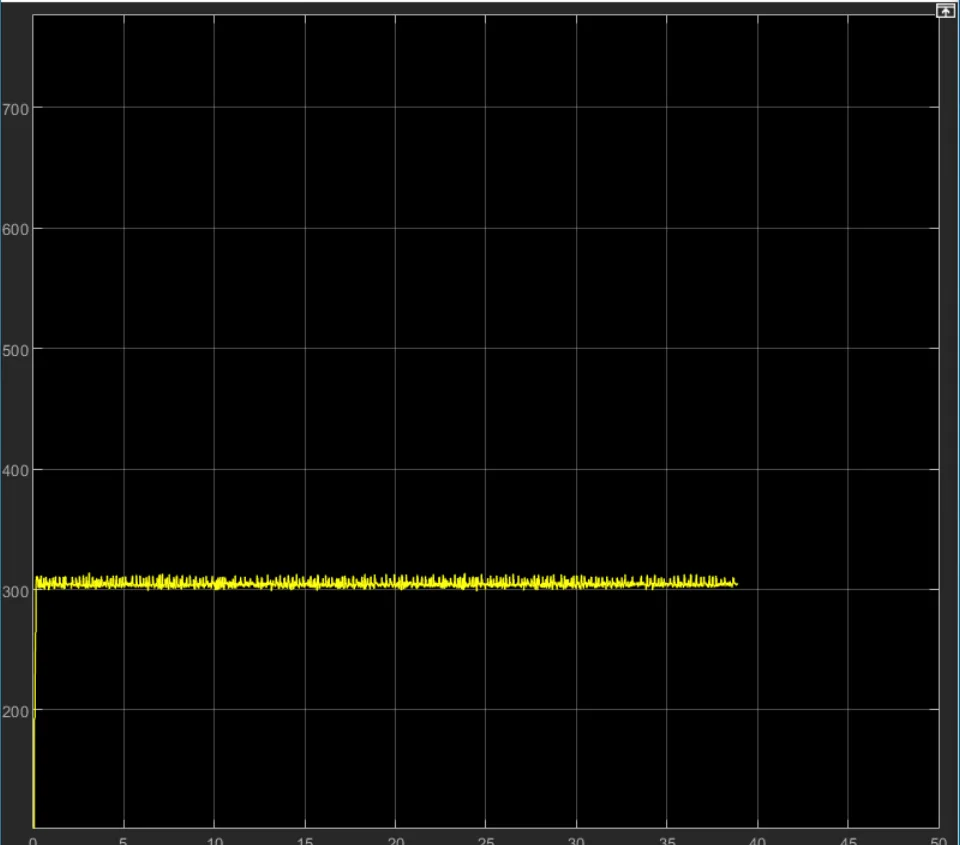
The response reached the commanded level quickly, but the transition was sharp and not perfectly smooth. In the physical setup, noise, quantization, and sensor placement all affect how clean the measured response appears.
Gain Comparison
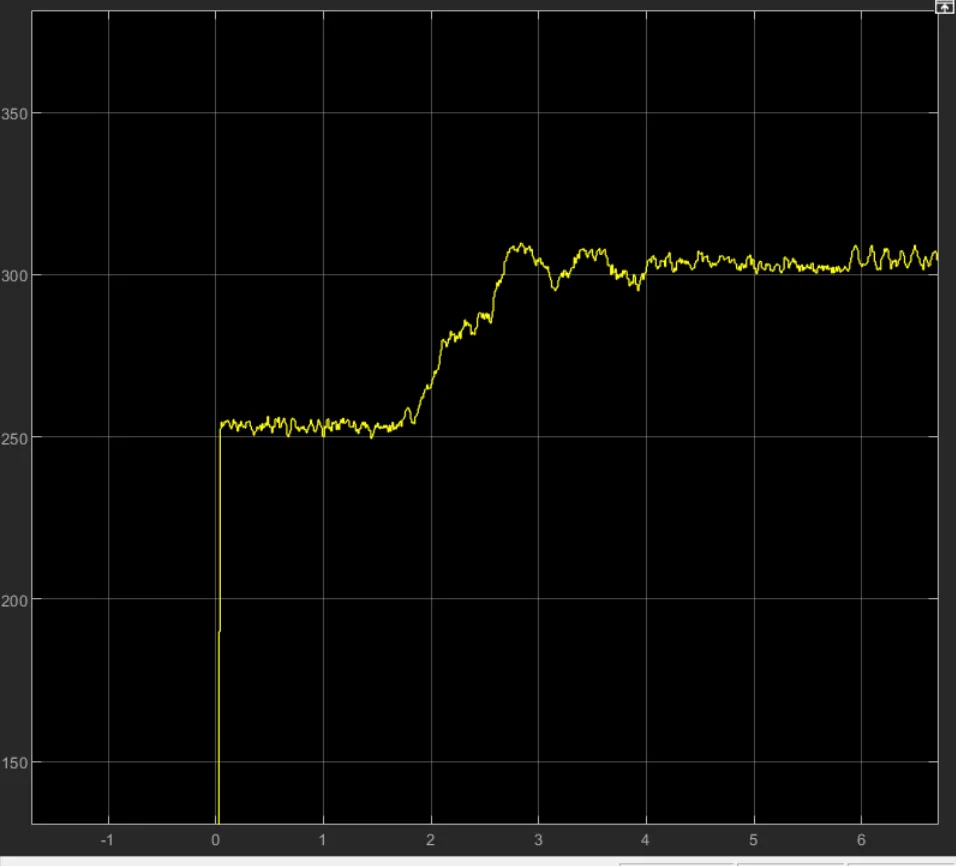
I then reduced the integral gain to 0.1 and reran the experiment in external mode. Compared with gain 1, the gain 0.1 response climbed more gradually toward the same target level.
Closed-Loop Instability
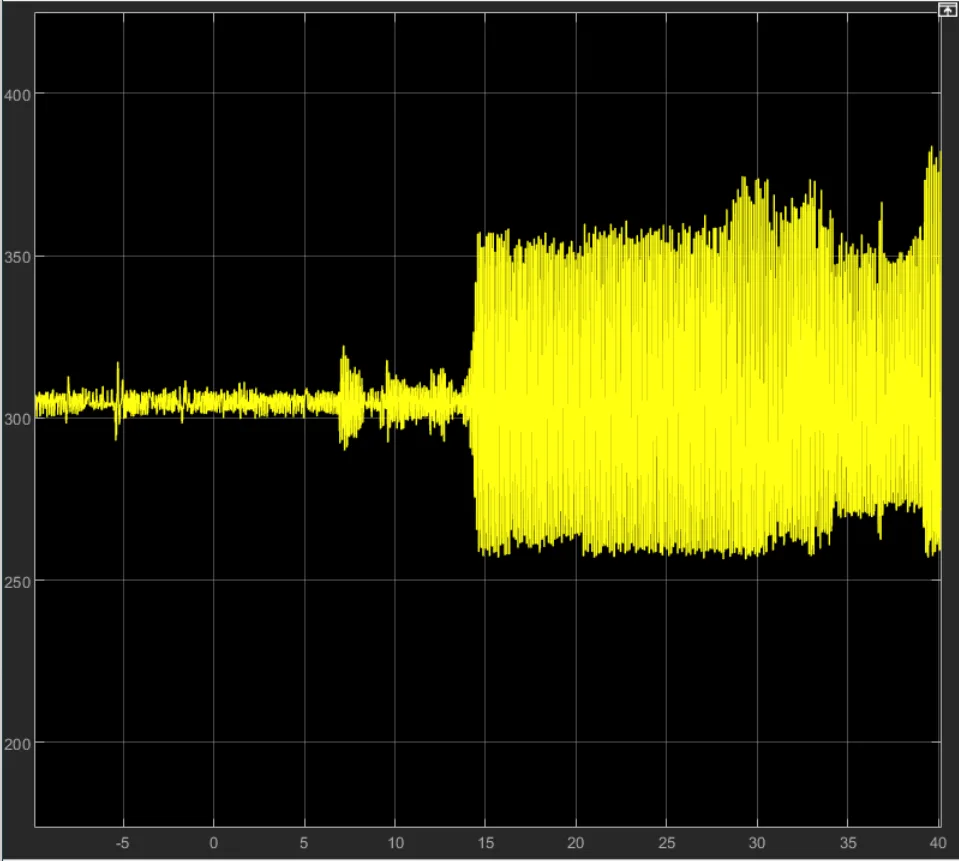
The handout framed the plant as a simple gain for controller design, but the real circuit still has high-frequency behavior. Increasing controller gain eventually exposed that limitation. In my test, a gain of 4 produced an oscillatory response instead of settling cleanly to the reference.
Outcome
The lab demonstrated the full feedback-control loop in a compact physical system: identify the plant, linearize the response, tune the controller, and then test the assumptions against real hardware. The Arduino Due was able to reject changes in ambient light by adjusting the LED output, while excessive gain showed how an otherwise simple controller can become unstable when real-world dynamics are ignored.